SymmetricPie
SRM 406 · 2008-06-18 · by eleusive
SRM 406 · 2008-06-18 · by eleusive · Brute Force
Problem Statement
Problem Statement
You've collected data in a int[] dogs which describes how many dogs are present in each neighborhood of your city, and you wish to represent this data in a pie chart. The total number of dogs in your city is exactly 100, so if a neighborhood has 15 dogs, it will form a solid region in the chart with an area equal to 15% of the whole pie chart.
Given a pie chart, a dividing line is a line that passes through the center of the chart and doesn't pass through the interior of any solid region of the chart. For example, the chart on the left has two dividing lines, while the chart on the right has only one dividing line (see examples 0 and 1 for the data that forms these two charts).
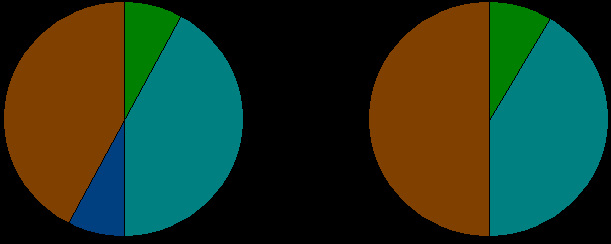
Note that there may be several ways to create a pie chart from the same data. Return the maximum number of dividing lines in a pie chart that can be made from the data.
Given a pie chart, a dividing line is a line that passes through the center of the chart and doesn't pass through the interior of any solid region of the chart. For example, the chart on the left has two dividing lines, while the chart on the right has only one dividing line (see examples 0 and 1 for the data that forms these two charts).
Note that there may be several ways to create a pie chart from the same data. Return the maximum number of dividing lines in a pie chart that can be made from the data.
Constraints
- dogs will contain between 1 and 8 elements, inclusive.
- Each element of dogs will be between 1 and 100, inclusive.
- The sum of all elements of dogs will be exactly 100.
Statement by TopCoder, Inc. — view the original on the archive.
Examples
0)
{25, 25, 25, 25}
Returns: 2
1)
{50, 50}
Returns: 1
2)
{100}
Returns: 0
3)
{95, 5}
Returns: 0
4)
{12, 25, 13, 25, 25}
Returns: 2
81)
{10,40,10,40}
Returns: 2
This is the left pie chart in the problem statement's diagram.
82)
{10,50,40}
Returns: 1
This is the right pie chart in the problem statement's diagram.
83)
{50,50}
Returns: 1
The only line here divides the chart through the center.
84)
{1,48,1,1,48,1}
Returns: 3
The best solution here is to put the regions in the order (1,1,48,1,1,48), giving us 3 dividing lines.
Submissions are judged against all 119 archived test cases, of which 9 are shown here. Case numbers match the judge’s.
Coding Area
Language: C++17 · define a public class SymmetricPie with a public method int getLines(vector<int> dogs) · 119 test cases · 2 s / 256 MB per case